Assignments
These two assignments open ended applications of the work that we have done in the rest of the course presented as a web-written document.
These two assignments open ended applications of the work that we have done in the rest of the course presented as a web-written document.

Quantitative Self-analysis of Pi's Procrastination and Minimization Measures Implemented
Pi Ko
Mar 12, 2022 - 1700 words . 5.7 min read
💻 Note : Please view the article on computer for best experience.

Figure : A Crash Course in Yak Shaving [ Source ]
This year, I learnt a new term, called "Yak Shaving". It says that when we try to focus on something, we often lose focus and end up doing millions of little other things which have nothing to do with our original task, but we still think that we are working on the original task. As someone who chose an intense Computer Engineering major, and has uncountable side projects under his belt, I usually believe that I am pretty productive, until life happens this semester. I realized that I yak shave a lot. I have not actually been working on the side projects as much as I think I am, and worse, this semester, my GPA resembles the stock market right now. It's going down 📉!
“My GPA resembles the stock market right now. It's going down!”
― Pi
The main culprit is of course, procrastination. Like a ninja 🥷, procrastination remains stealth and assassinated my valuable free time, minute by minute. Still, my brain fools me that I am still productive. However, there is no concrete data or evidence to analyze where, when and how I procrastinate, and what triggers it. Therefore, I decided to publicly track my procrastination data in my Quantified Self class, so that I can make changes to my lifestyle to minimize it.
Due to my work, I spend an average of 10 hours on my computer daily, and usually, 9 out of those 10 hours are on web browsers. While not on web, I am usually coding on my computer or doing game design. Therefore, I assume that all of my procrastination occurs on the web. Therefore, my main objective is to track the "Web-Based Procrastination", and how much time I actually "work".
To track procrastination, I used a Chrome extension called TimeYourWeb, which records my browsing history, and the time I spent on each website. This makes it easy to track procrastination, because particular websites are associated with productivity (e.g. Google Docs, Github) while others are associated with procrastination (e.g. Facebook and Social Media). I classify my procrastination and productivity time based on the websites I visit. Of course, there are exceptions like YouTube, where I learn new tech skills, and browse meme videos. Such websites are evaluated on case by case basis daily.
When I work, I use the Pomodoro Technique 🍅, where I split my working time into 25 minute intervals and focus on a task each time. To track my working time, I use a Pomodoro timer called Flow, while working on computer. The following data is tracked daily for 28 days.
Date : Date of a particular day
Web-Based Schoolwork (Hours) : Number of hours spent on web-based school work. Websites for this category includes (Brightspace, WebAssign, Overleaf, Google Docs, Google Drive and Desmos)
Personal Projects (Hours) : Number of hours spent on research, personal projects or learning web development and other softwares. Websites for this category includes (Leetcode, GitHub, YouTube, Google Colab, and other programming documentation sites)
Web-Based Procrastination (Hours) : Number of hours spent browsing random topics to pass time. These are any websites which does not fall in either schoolwork or personal learning categories. Examples includes, but not limited to (Facebook, Instagram, Reddit, Messenger,Quora). This is calculated by subtracting the time spent on school work and personal learning from the total web browsing time per day.
Total Time Spent on Web (Hours) : Total hours spent per day on web browser, taken directly from Chrome Extension
Total Pomodoro Sessions (Hours) : Number of hours which I spend working actively on computer, using Pomodoro Technique. (1 Pomodoro Session = 25 Minutes)
Subjective Score : A score from 0 to 10 based on gut feeling. 0 means no productivity at all. 10 means maximum productivity.
Remark : A brief subjective description of the day
As mentioned, for data collection a Chrome Extension called TimeYourWeb is used to track the time spent on each website. Flow is used to monitor the working duration. The data is then exported as comma-separated values (CSV) file into Google Sheets. However, classification of websites into procrastination or productivity is done manually by hand 🤚.
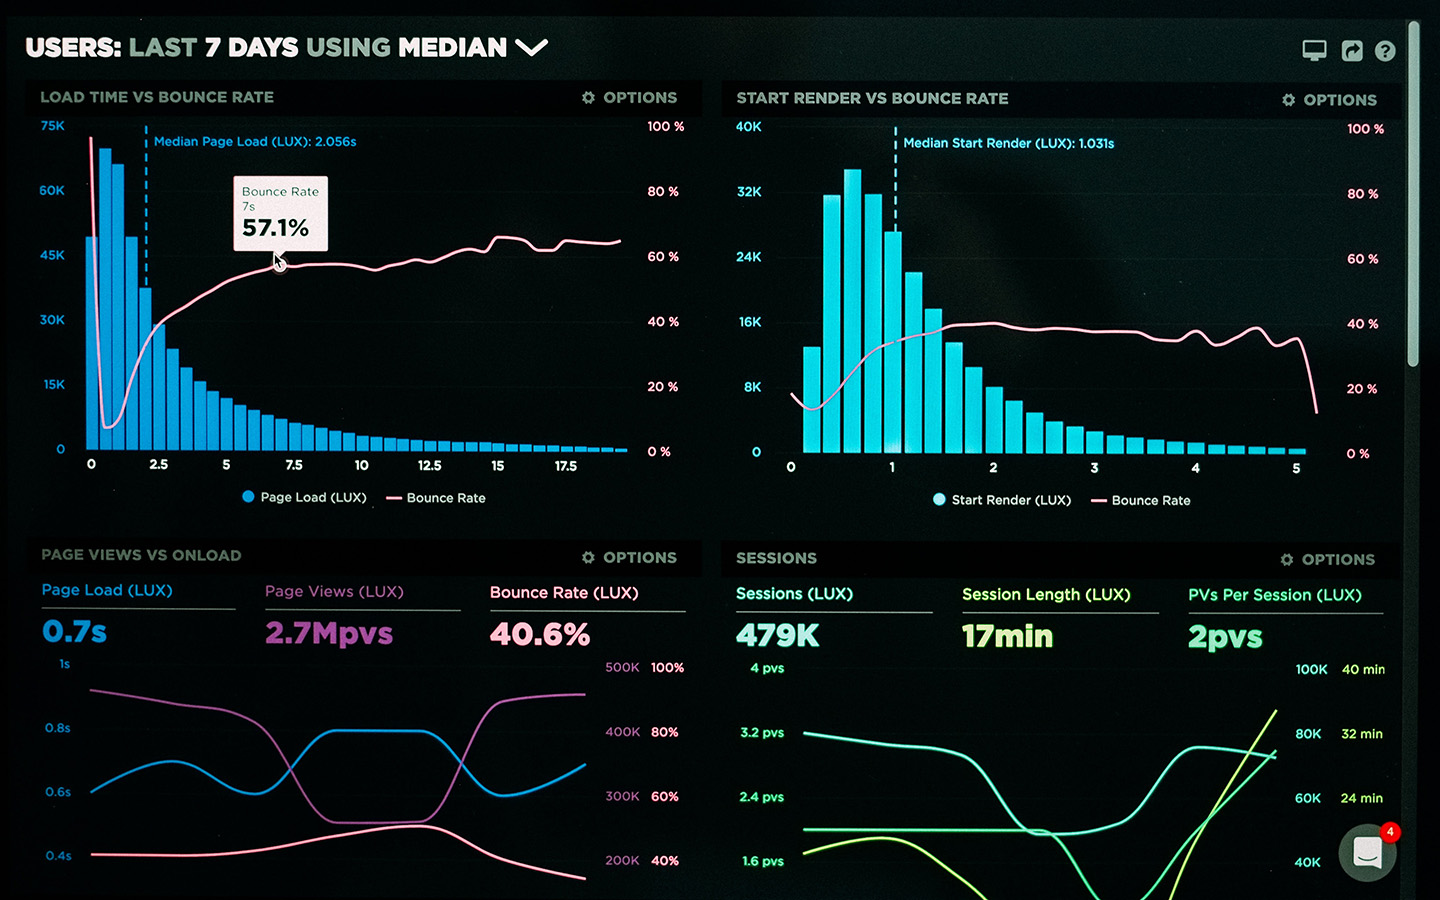
Figure : Web Browsing History and Time Spent tracked by TimeYourWeb
Figure : Working Duration on computer, tracked by Flow App
Figure : Statistics on daily working durations, by Flow App
Once the data classified by hand, Google Sheets is used to store and analyse the data. Data Visualization is done by using a JavaScript library called Chart.js.
💻 Note : All the code for data visualization can be seen on this project's Github Repo.

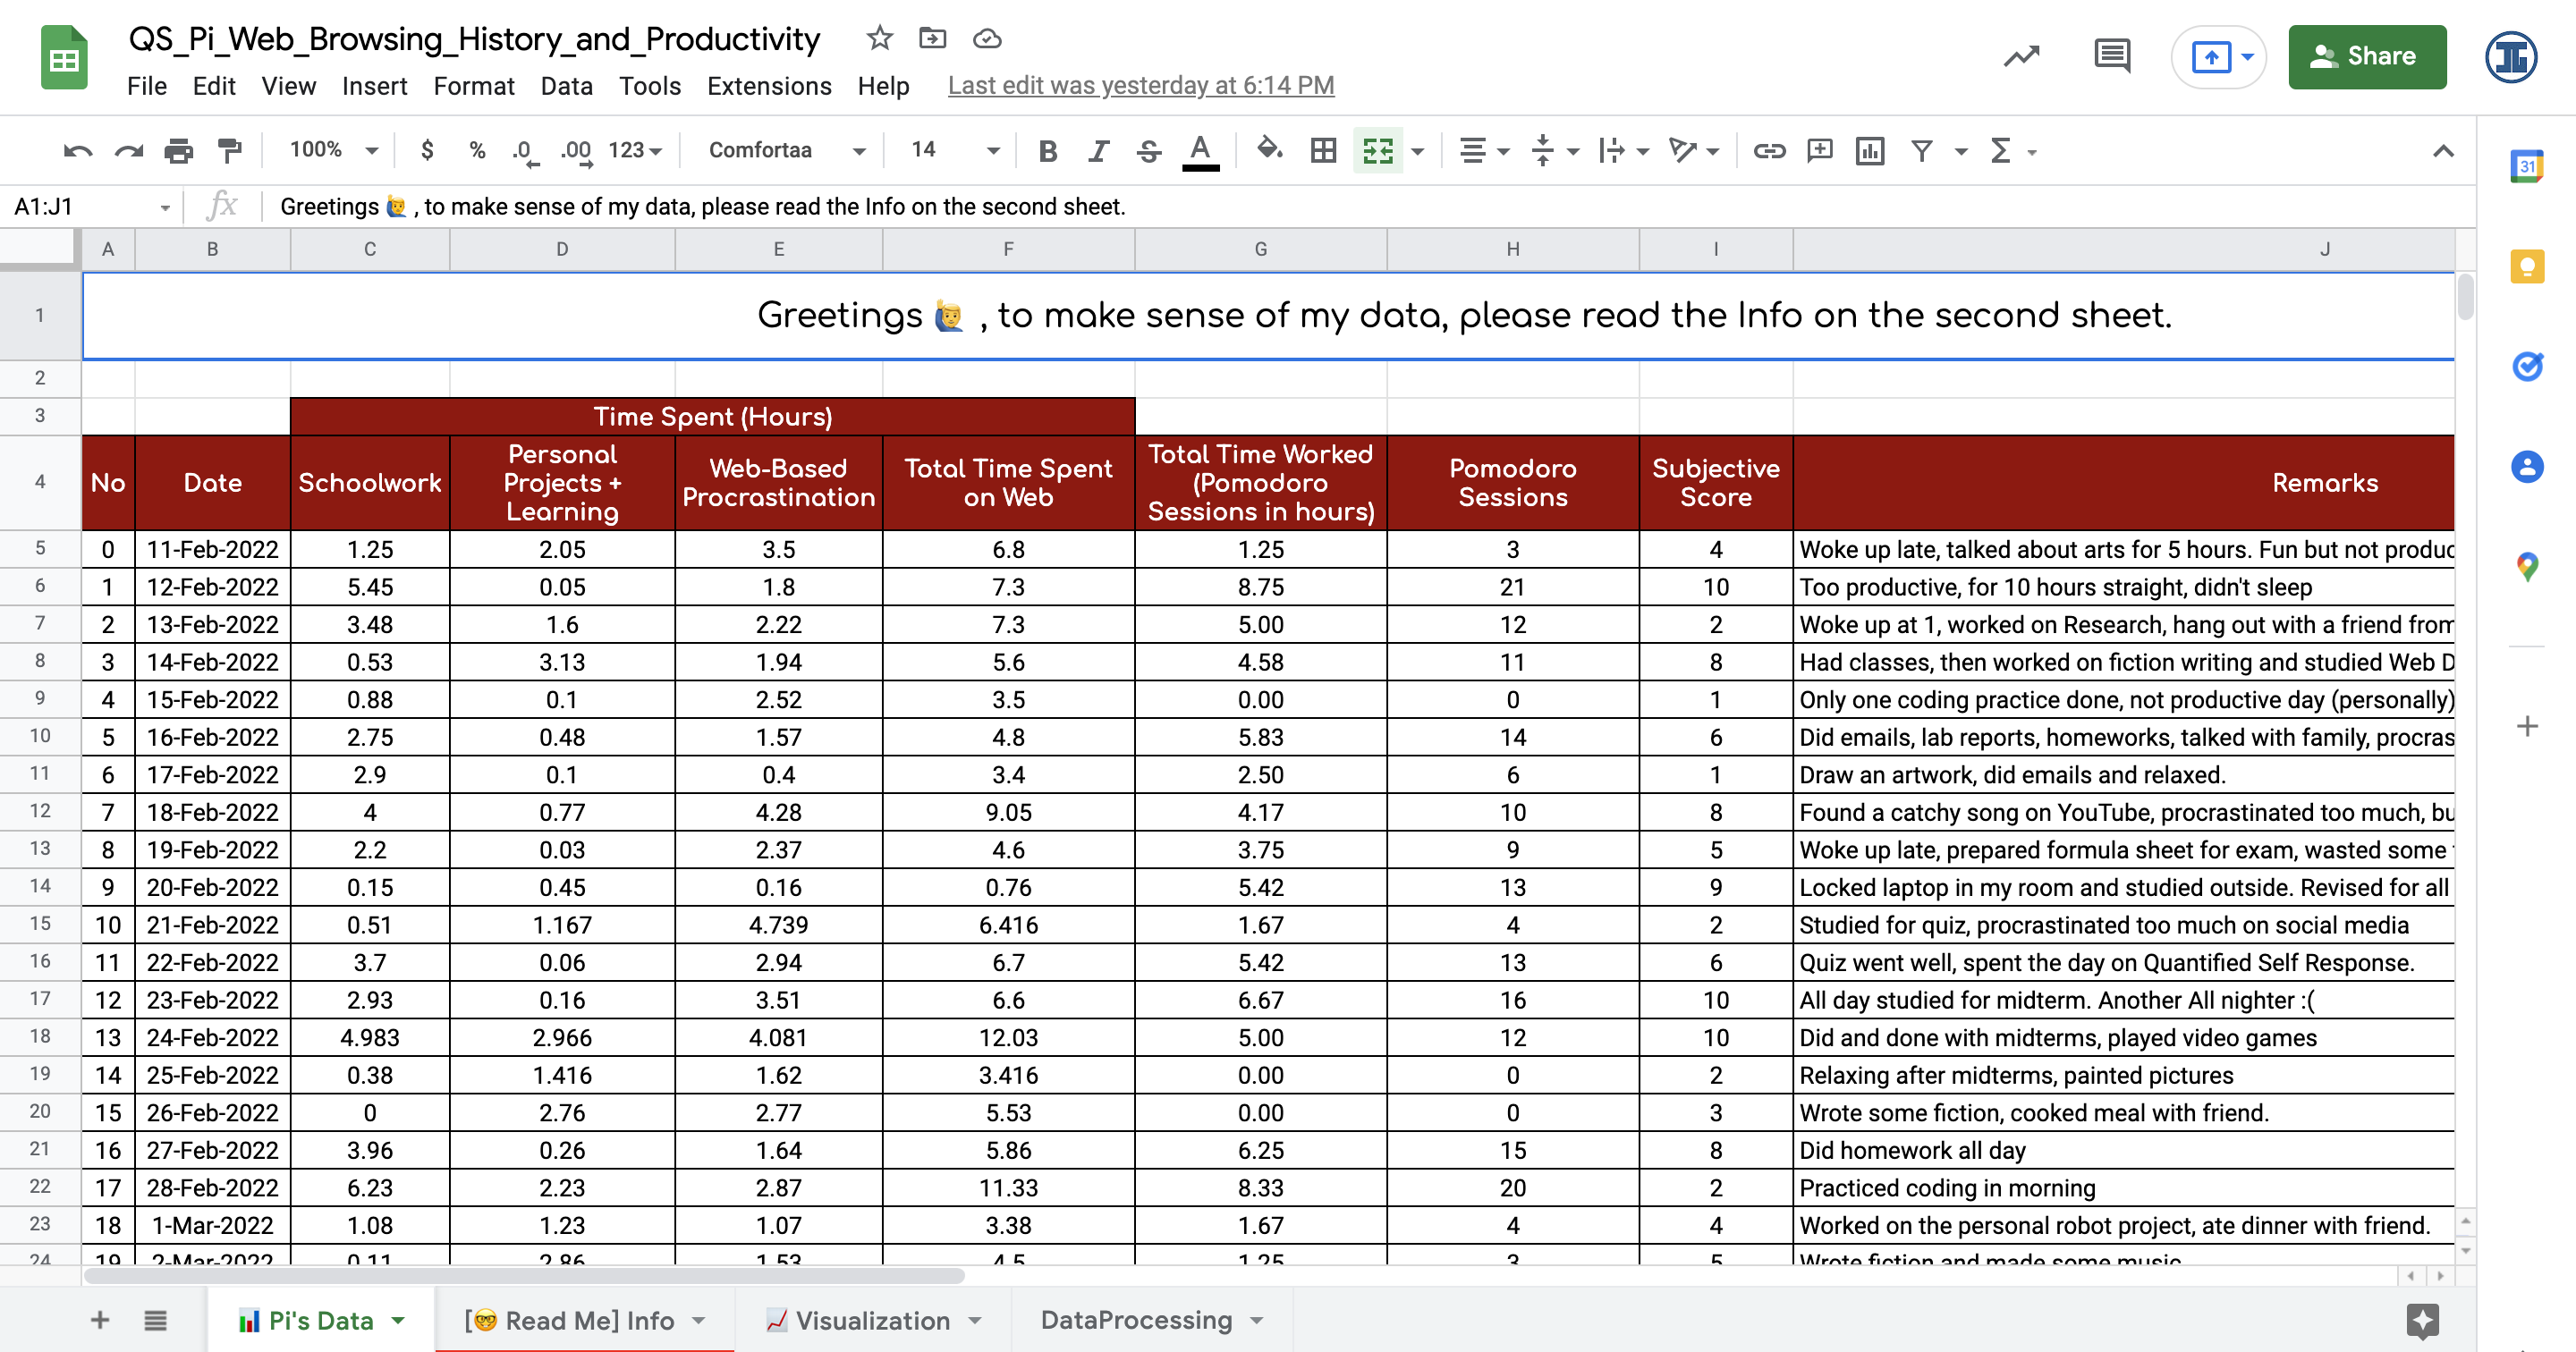
Figure : Data cleaned and processed in Google Sheets
The cleaned tabular data is shown below, without subjective remarks.
📊 Note : Download the full data (with summary of the day) as csv here.
| Date | Web-Based Schoolwork (Hours) | Personal Projects (Hours) | Web-Based Procrastination (Hours) | Total Time Spent on Web (Hours) | Total Pomodoro Sessions (Hours) | Subjective Score |
|---|---|---|---|---|---|---|
| 11-Feb-2022 | 1.25 | 2.05 | 3.50 | 6.80 | 1.25 | 4 |
| 12-Feb-2022 | 5.45 | 0.05 | 1.80 | 7.30 | 8.75 | 10 |
| 13-Feb-2022 | 3.48 | 1.60 | 2.22 | 7.30 | 5.00 | 2 |
| 14-Feb-2022 | 0.53 | 3.13 | 1.94 | 5.60 | 4.58 | 8 |
| 15-Feb-2022 | 0.88 | 0.10 | 2.52 | 3.50 | 0.00 | 1 |
| 16-Feb-2022 | 2.75 | 0.48 | 1.57 | 4.80 | 5.83 | 6 |
| 17-Feb-2022 | 2.90 | 0.10 | 0.40 | 3.40 | 2.50 | 1 |
| 18-Feb-2022 | 4.00 | 0.77 | 4.28 | 9.05 | 4.17 | 8 |
| 19-Feb-2022 | 2.20 | 0.03 | 2.37 | 4.60 | 3.75 | 5 |
| 20-Feb-2022 | 0.15 | 0.45 | 0.16 | 0.76 | 5.42 | 9 |
| 21-Feb-2022 | 0.51 | 1.17 | 4.74 | 6.42 | 1.67 | 2 |
| 22-Feb-2022 | 3.70 | 0.06 | 2.94 | 6.70 | 5.42 | 6 |
| 23-Feb-2022 | 2.93 | 0.16 | 3.51 | 6.60 | 6.67 | 10 |
| 24-Feb-2022 | 4.98 | 2.97 | 4.08 | 12.03 | 5.00 | 10 |
| 25-Feb-2022 | 0.38 | 1.42 | 1.62 | 3.42 | 0.00 | 2 |
| 26-Feb-2022 | 0.00 | 2.76 | 2.77 | 5.53 | 0.00 | 3 |
| 27-Feb-2022 | 3.96 | 0.26 | 1.64 | 5.86 | 6.25 | 8 |
| 28-Feb-2022 | 6.23 | 2.23 | 2.87 | 11.33 | 8.33 | 2 |
| 1-Mar-2022 | 1.08 | 1.23 | 1.07 | 3.38 | 1.67 | 4 |
| 2-Mar-2022 | 0.11 | 2.86 | 1.53 | 4.50 | 1.25 | 5 |
| 3-Mar-2022 | 6.00 | 0.10 | 4.61 | 10.71 | 2.92 | 9 |
| 4-Mar-2022 | 0.13 | 2.67 | 1.70 | 4.50 | 0.42 | 8 |
| 5-Mar-2022 | 0.00 | 1.76 | 3.04 | 4.80 | 1.67 | 2 |
| 6-Mar-2022 | 0.60 | 3.02 | 1.30 | 4.92 | 1.25 | 2 |
| 7-Mar-2022 | 2.31 | 2.38 | 1.81 | 6.50 | 3.33 | 8 |
| 8-Mar-2022 | 4.60 | 0.48 | 1.42 | 6.50 | 2.92 | 7 |
| 9-Mar-2022 | 4.30 | 0.13 | 0.52 | 4.95 | 4.58 | 10 |
| 10-Mar-2022 | 2.78 | 0.07 | 1.65 | 4.50 | 3.75 | 4 |
⚠️ IMPORTANT : All the data visualization below are interactive. Please see Pi's tutorial 🎥 first, for a more immersive experience.
While the time series above summarizes the data, general patterns can be observed by analyzing the subsets of data, in different ways as below.
Firstly, I kept track of the categories of websites I visited too. As seen above, I am addicted to Facebook. I spend around 24% more time on Facebook than the academic websites where I do my homework (e.g. Web Assign, Brightspace). Surprisingly, YouTube is did not waste my time that much.
Secondly, we can see that I procrastinated every day. As in scatter plot above, the more time I spent on web, the more I procrastinate. Even on the day where I locked my laptop in my room and studied outside (leftmost data point), I wasted 10 minutes on Facebook.
Moreover, as in the Doughnut chart above, my procrastination time approximately equals my schoolwork duration on average (around 40% of total web browsing time). I procrastinated twice more than the time I spend on my personal projects. This is humiliating 😢.
In addition, as seen in the trend above, I procrastinate about 2.27 hours per day on average. The pattern is that if there are any days where I procrastinate too little, they are followed by days where I procrastinate a lot (e.g. 20th and 21st Feb). Web-based procrastination sums up to 64 hours during this experiment, which is 3 days per month.
“My rate of procrastination is 3 days per month.”
― Pi
Lastly, the graph above suggests that roughly, I have a correct estimation of how productive I am. There is a weak relationship between the subjective score I assign and the total time I work. The outliers may be because on those days, I worked on things which did not require my computer (e.g. writing homework on paper).
From the observations above, we can formulate the following Pi's Laws of Procrastination, assuming all other factors remain constant.
First Law : Procrastination is inevitable. I either procrastinate a healthy amount of 2.27 hours per day, or expect extreme lows followed by extreme highs.
\(\frac{\partial }{\partial t} \left( T_{\text{procrastination}}[n+1]\right)=-k \frac{\partial}{\partial t} \left( T_{\text{procrastination}}[n]\right) \)
\(\forall n \in \mathbb{Z} , T_{\text{procrastination}} > 0 \)
Second Law : On average, I procrastinate as much as I work.
\( \lim_{n \to +\infty} \frac{\sum_{i=0}^{n} T_{\text{procrastination}}[i]}{n} \approx \lim_{n \to +\infty} \frac{\sum_{i=0}^{n} T_{\text{working time}}[i]}{n}\)
Third Law : The more time I spend on web, the more I procrastinate.
\(T_{\text{procrastination}}\approx 0.4 \times T_{\text{time on web}} \)
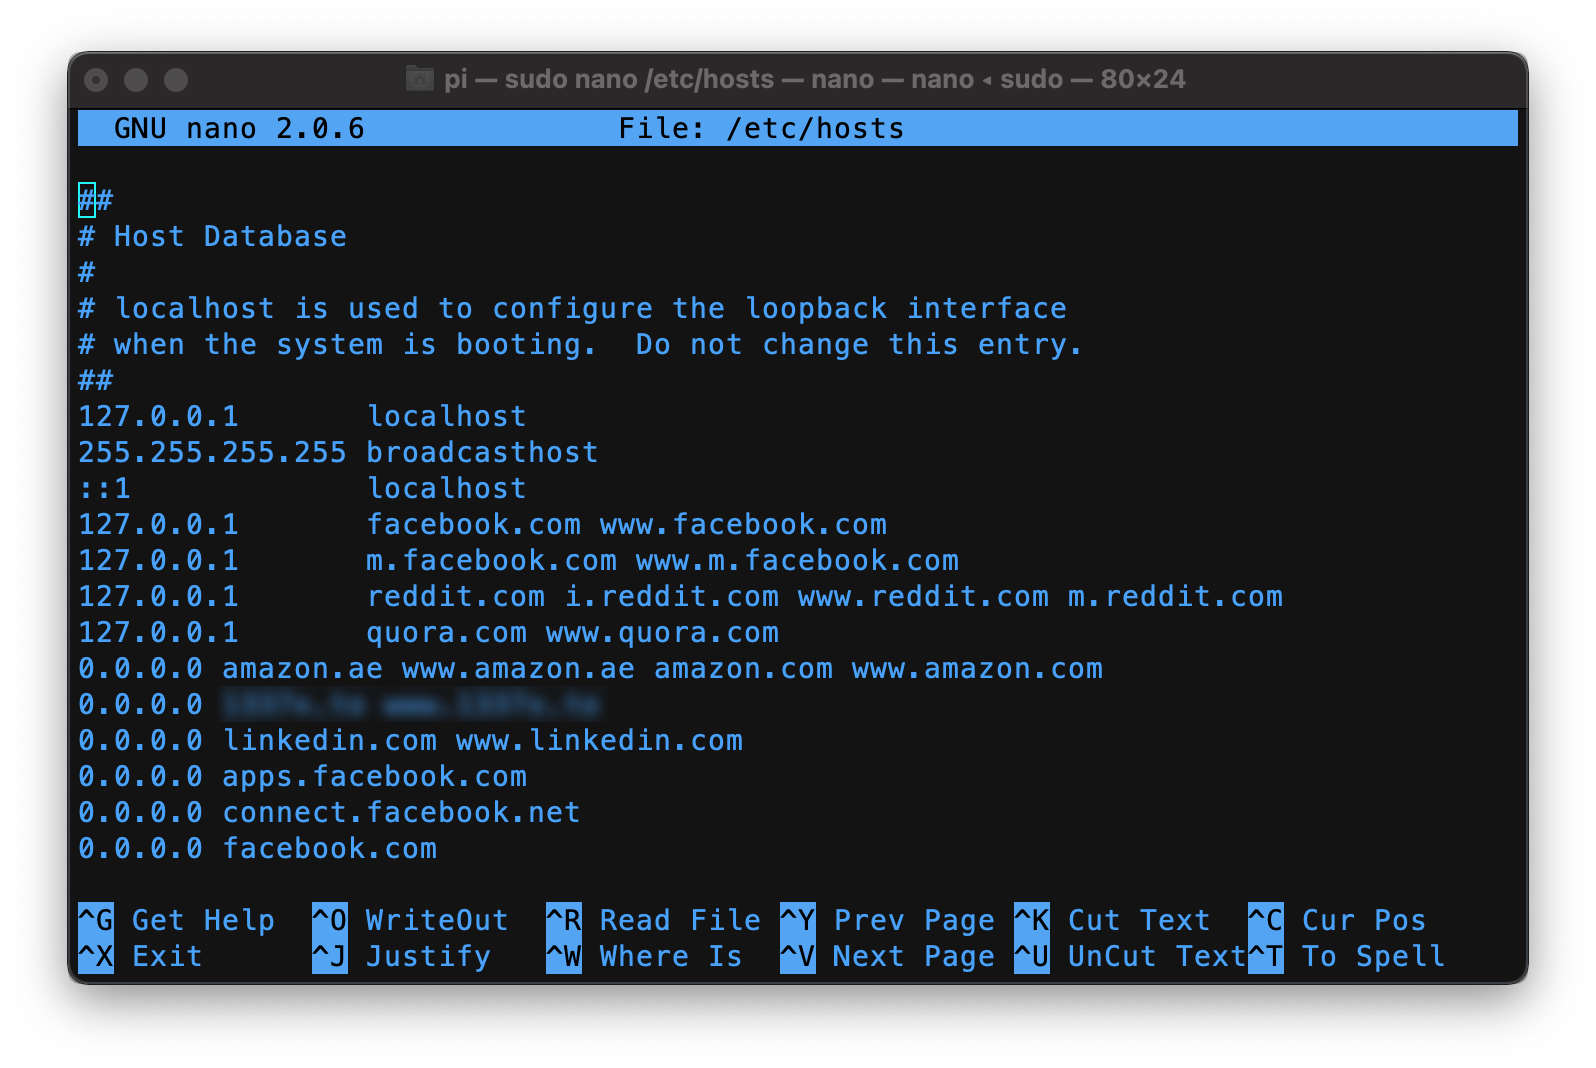
Now that I know I am addicted to Facebook (and other social media), I decided to cut down the usage by blocking it. I have tried blocking it with Chrome Extensions in the past, but they are ineffective because it only takes me a few clicks to remove the restrictions in the same browser. Therefore, I take a step further this time by blocking all social-media related URLs on my computer host file as below.

Figure : Blocking Facebook and other time killers by Host File
(Blocking Amazon also saved my dollars 💰)
Of course, I can never fully censor anything, but can only make it difficult to access. This is the most technically difficult I can go (without blocking my WiFi).
Moreover, when I estimate the time required to work these days, I also take the procrastination time ⌚ into account, which is approximately equal to the time taken for that task.
“If I think I will take 1 hour to do a particular task, the actual time required is at least 2.5 hours 🤯 .”
― Pi
The following are my answers to some guiding questions.
How easy or difficult was it to remember always to complete / process the tracking data?
Remembering the data collection was not a problem since data collection was automated. Only the manual classification of data took me some time.
Did the visualization software impose some constraints you would have not preferred to have?
Not at all, and this is the reason why I selected Chart.js library, and decided to code this website myself 👨💻. I was able to implement all the visual storytelling I wanted. This way, I was able to implement by subjective data to pop-up when viewers hover on my graphs produced from objective data.
Would you prefer for this data to be "forgotten"?
No. Productivity is very important to me and I was going to do this project anyway even if this assignment did not exist. However, this assignment forced me to do this data tracking more properly.
If you were to collect much more data (either over a longer time or with many more data points per day), how might your conclusions differ?
I blocked all social media on 8th Mar 2022, which is 2 days before experiment ended. Therefore, the effects of this blockage is not visible. I will continue to collect the data, and I expect a significant decrease in average daily procrastination time.
Of course, this experiment comes with limitations. Ones I can identify are as follows.
My project has partial resembalance to Giorgia Lupi and Stefanie Posavec's Dear Data project since I am visualizing the data about a part of my life. However, there are main differences because mine is a quantified-self project, wheras theirs is not. In their own words -
“We’ve always conceived Dear Data as a personal documentary rather than a quantified-self project which is a subtle – but important – distinction. ”Moreover, I collected data over a long term wheras Dear Data changes the data type every week. Their main purpose was to keep the communication between friends going while my objective is to gain knowledge about my procrastination and make changes to my life.
― Dear Data Website
My project resonates more with Benjamin Franklin. Although Franklin was aiming for moral perfection, and I was aiming for procrastination reduction, we have a common purpose - to improve oneself through collecting data.
“ It was about this time I conceived the bold and arduous project of arriving at moral perfection. I wish'd to live without committing any fault at any time; I would conquer all that either natural inclination, custom, or company might lead me into.”
― Autobiography of Benjamin Franklin, by Benjamin Franklin
However, Franklin's data is very subjective wheras mine is more concrete and quantifiable. Moreover, Franklin focused on multiple virtues (or data types), wheras I am only focused mainly on procrastination data. If I remember the reading correctly, Franklin did not include a method or measure to correct his actions through the analysis of his data, since he only talks about self-examination. My project, in contrast, suggests methods to reduce my procrastination time, like a self-correcting feedback loop through the analysis of my data.
✓ Ready to Grade - 12th Mar 2022